Download here: State Assessment Gains from 2013-19
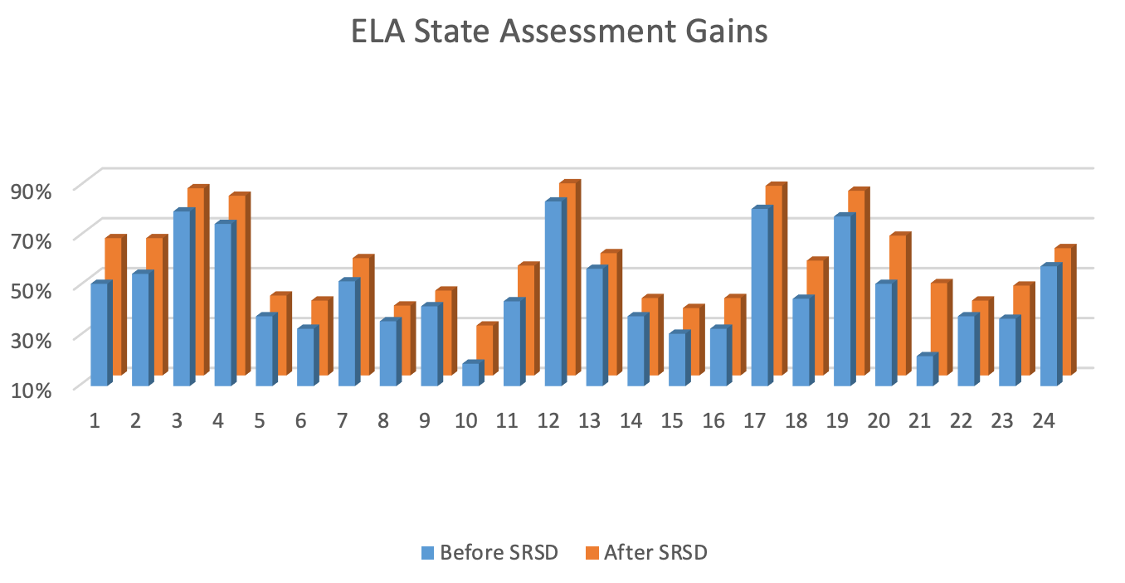
The above chart lists gains made in overall ELA proficiency (vertical axis) in schools and districts (numbered across horizontal axis) supported by thinkAUM (DBA: thinkSRSD). The data here show ELA assessment outcomes annually reported on respective SEA websites and demonstrate overall student scores prior to implementation SRSD (blue) and the year of implementation (orange). Implementing grade levels listed below.
While schools partnering with thinkAUM’s achieve an average gain of 7%, some schools have more than doubled their outcomes. Bar #21, for example, shows gains made at the Goff School in Pawtucket, RI in 2019. Students’ outcomes (in the participating grade) rose from 22% in 2018 to 47% proficient or advanced on their state assessments (Unpublished analysis, see Appendix J.2). A neighboring district in Cumberland, RI has likewise seen increased state ELA assessment performance, rising from ranking above 41% of the districts in their state in 2013 to surpassing 71% by 2019. Their superintendent, Robert Mitchell, has stated that the “SRSD writing process instructional initiative caused these gains.”
ELA Data (with clickable links) from Schools with Embedded & Sustained SRSD Implementation
| School/District/State | 2013 | 2014 | Gains | |
|
MCAS |
3rd Gr: 56% 4th Gr: 46% |
3rd Gr: 63% 4th Gr: 67% |
+14%
|
|
|
MCAS |
3rd Gr: 58% 4th Gr: 52% |
3rd Gr: 69% 4th Gr: 60% |
+10% 4th Grade: Highest Ever |
|
|
MCAS |
All: 80% | All: 85% |
+5% Highest Ever |
|
|
MCAS |
3rd Gr: 75% 4th Gr: 74% |
3rd Gr: 82% 4th Gr: 81% |
+7% Highest Ever |
|
| School/District/State | 2014 | 2015 | ||
|
5. Rivera School, New York, NY ENY |
All: 38% | All: 42% |
+4% Highest since ENY |
|
|
PARCC* |
MCAS: 33% | PARCC: 40% | +7% | |
|
PARCC* |
MCAS: 52% | PARCC: 57% | +5% | |
|
PARCC* |
MCAS: 36% | PARCC: 38% | +2% | |
| School/District/State | 2015 | 2016 | ||
|
9. Rivera School, New York, NY ENY |
All: 42% | All: 44% |
+2% (year 2) Highest since ENY |
|
|
ENY |
All: 19% | All: 30% | +11% | |
|
PARCC |
PARCC: 44% | PARCC: 54% |
Gr 7: 4% Gr8: 17% |
|
|
PARCC |
PARCC: 84% | PARCC: 87% |
3% (year 3) Highest ever |
|
|
PARCC |
PARCC: 57% | PARCC: 59% | 2% | |
|
14. Burncoat ES, Worcester, MA MCAS |
MCAS: 38% | MCAS: 41% | 3% | |
|
MCAS |
MCAS: 31% | MCAS: 37% | 6% | |
|
PARCC |
PARCC: 33% | PARCC: 41% | 7% (year 2) | |
|
MCAS |
PARCC: 81% | PARCC: 86% |
5% Highest gains ever |
|
| School/District/State | 2017 | 2018 | ||
|
MCAS New Gen |
All: 45% | All: 56% |
+11% (8 schools)
|
|
|
MCAS New Gen |
Gr 4-5: 78% | Gr 4-5: 84% |
6%
|
|
|
MCAS New Gen |
All: 51% | All: 66% | +15% | |
| School/District/State | 2018 | 2019 | ||
|
(Pawtucket, RI; Gr 6) RICAS (Same test as MCAS) |
(Gr 6: 17) Gr 6: 22 |
(Gr 6: 30) Gr 6: 47 |
(+17% partial implementation) +25% |
|
|
22. Worcester, MA (full district) MCAS |
Gr 3-6: 38 | Gr 3-6: 40 |
+2 (45 schools)
|
|
|
NY State Assessment |
Gr 3-5: 37 (2017) | Gr 3-5: 46 | +6 | |
|
RICAS (Same test as MCAS) |
All: 58 | All: 61 | +3 (7 schools) | |
Raw Data Published by SEAs for Each State:
| Year | School, District | Before SRSD | After SRSD |
| 2013-2014 | 1. Pingree, Weymouth (Gr 3-4) | 51% | 65% |
| 2. Ayer-Shirley (Gr 3-4) | 55% | 65% | |
| 3. Worcester Arts, Worcester | 80% | 85% | |
| 4. Wayland (Gr 3-4) | 75% | 82% | |
| 2014-2015 | 5. Rivera School, NY | 38% | 42% |
| 6. Wawecus, Worcester | 33% | 40% | |
| 7. Thorndyke, Worcester | 52% | 57% | |
| 8. Clarke Street, Worcester | 36% | 38% | |
| 2015-2015 | 9. Rivera School, NY | 42% | 44% |
| 10. School of Science & Tech, NY | 19% | 30% | |
| 11. Burncoat MS, Worcester | 44% | 54% | |
| 12. Worcester Arts, Worcester | 84% | 87% | |
| 13. Thorndyke, Worcester | 57% | 59% | |
| 14. Burncoat ES, Worcester | 38% | 41% | |
| 15. McGrath, Worceter | 31% | 37% | |
| 16. BF Norton, RI | 33% | 41% | |
| 17. Elmwood, Hopkinton | 81% | 86% | |
| 2017-2018 | 18. Weymouth (8 schools) | 45% | 56% |
| 19. Hopkins, Worcester | 78% | 84% | |
| 20. Hatfield | 51% | 66% | |
| 2018-2018 | 21. Goff, Pawtucket RI (Gr 6) | 22% | 47% |
| 22. Worcester (45 schools) | 38% | 40% | |
| 23. PS 200, NY | 37% | 46% | |
| 24. Cumberland, RI (7 schools) | 58% | 61% | |
| 49% | 56% |